How to plot a diagrams
Let’s use the example from the post about BASIC programing – Example BASIC program. To plot the graph of a quadratic equation on the ZX Spectrum, you can use the built-in graphics capabilities of the computer. Here’s an example ZX Spectrum Basic program that plots the graph of a quadratic equation:
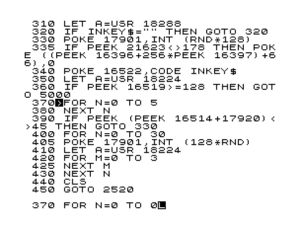
10 PRINT „Quadratic Equation Graph”
20 PRINT „Enter the coefficients:”
30 INPUT „a: „, a
40 INPUT „b: „, b
50 INPUT „c: „, c
60 LET x = -10
70 LET y = a*x*x + b*x + c
80 FOR i = 1 TO 20
90 LET x = x + 1
100 LET y = a*x*x + b*x + c
110 PLOT x+128, 96-y
120 NEXT i
130 PRINT „End of program”
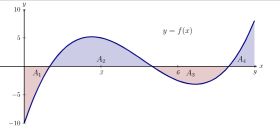
This program prompts the user to enter the coefficients (a, b, and c) of a quadratic equation. It then uses a loop to calculate the y-coordinate for a range of x-values (-10 to 10 in this example) using the quadratic equation formula.
The PLOT statement is used to plot the calculated points on the screen. The x-coordinate is adjusted by adding 128 to center the graph horizontally, and the y-coordinate is subtracted from 96 to invert the graph vertically since the screen coordinates on the ZX Spectrum start from the top-left corner.
The loop iterates through the range of x-values, calculates the corresponding y-values, and plots the points on the screen. The result is a graph that represents the quadratic equation.
Finally, the program prints „End of program” to indicate the completion of the execution.
You can type and run this program on a ZX Spectrum computer or in an emulator to plot the graph of a quadratic equation. The resulting graph will be displayed on the screen.